This project, an attempt to find the fractal dimension of the network, resulted from a long email exchange between myself and Ralph Abraham. My totally non-mathematical approach to the idea led me to compare the complex pattern of connections between all users of the network to the ever-expanding line of Koch’s curve – an infintely long line in a finite space. Ralph came up with the name and the procedure for mapping the connections.
“Webographics”
A Mathematical Model of Network Activity
INTRODUCTION:
The objective of this project is to develop a mathematical model of the network as a way of better understanding its operation. We feel strongly that the network is a prototype of future socio-politico-cultural organization, and, for that reason, it is important to understand its functioning, the place of the individual in it and his relation to other members of it and avoid applying to it outdated or irrelevant procedures derived from other media, technologies or cultural habits. The network, in its interactivity, will be in the 21st century the operational metaphor – the paradigm – of our civilization and its geometry, the geometry of our imagination.
The mathematical model of the network operation is fractal, a complex system with the potential number of connections tending toward infinity. At first glance, a large number of links between several points on a globe would give us a geodesic sphere, but such a structure implies connections with only immediate neighbors. In a network all connections are on a one-to-one basis, without the need to go through any intermediary point. This multiplies the number of potential connections rapidly, and the addition of any new member increases enormously that number. As the number becomes larger, tending toward infinity, the pattern of connections slides away from that of an extremely complex line on the surface of the sphere and approaches that of a spherical plane – an infinite number of connections contained in a finite space. The dimension must be spherical, between one – a line – and two – a plane, thus a fractal.
In using the geodesic sphere as a model, we stay within the realm of classical geometry and cut ourselves off from the actual description of human activity on the network that we define more precisely when using a fractal approach. There is, in fact, a strong probability of there being two geometries super-imposed, one, the geodesic, a spherical trigonometrical network of wire encircling the globe which is the physical connectedness and two, the fractal dimension of its functioning.
The mathematical model will permit snap-shots of any domain system of the network and the accumulation of those snap-shots will give a moving picture of the functioning of the domain over time.
WHO:
Ralph Abraham, chaos mathematician at the University of California at Santa Cruz and Don Foresta, international coordinator of the MARCEL network in Paris, are developing the model and have defined the necessary givens permitting the construction of an on-line model capable of giving snap-shots of any part of the network’s activity.
MAPS:
As a first approach there are two levels of mapping:
level 1: demographic (2 dimensions of planet earth)
level 2: neural net (graph in four dimensional space)
Level 1:
is a map of world, each continent colored to indicate the number of web pages per capita (ca 6.0 in the USA). Click on any continent and another map of that continent shows every country colored to indicate the number of web pages per capita.
Level 2:
a practical model achieved by experimenting with the real thing. There are now about 110,000 servers on the web each keeps a log, thus the real network is a virtual object recorded in these logs from which we could compute a tree of frequencies.
HOW TO DO THE MEASURING:
With a www index system using the search command “link: <url>” all the pointers to a given url or page can be found. This can be quantified with usual query language thus, all link paths from url-1 to url-2 can be counted. This makes the www into a neural net.
VISUALIZATION OF MASSIVE NEURAL NETS:
Suppose given a massive neural net, that is, for which the size, N, may be on the order of tens or hundreds of thousands. How to observe its instantaneous state, or a sequence of states, to understand its evolution? We present here only one of many possible strategies, already inherent in the neural net approach: the view of the matrix of connection strengths as a two-dimensional image. This may be done in shades of gray, or through translation by a color table. There are two serious problems with this approach. Never-the-less, we advocate it here, and plan to pursue it in further work.
The first problem is in the massive size of the image. As computer screens and printed pages are generally limited to a size of one thousand or so, the literal image of a matrix of size N as conceived here must cover many computer screens, or many pages of print. The obvious solution to this problem of massive size is an intentional reduction of resolution, by pixel averaging for example.
The second problem is in the fictitious representation of the nodes in linear order, that is, as a one-dimensional geographic space, when in fact, the ordering given by the index (I) is arbitrary, or logical, or anything but geographical. In case there is a geometric or geographical map for the nodes of the neural net, its dimension is usually greater than one, and so the representation within a one-dimensional space is forced and artificial.
Worse yet, these two problems aggravate each other. For averaging neighboring pixels, when the proximity of nodes has no natural significance, may destroy all significance in the image, providing a very foggy (that is, fractal) visualization of the net. Nevertheless, we feel this approach has a certain promise, as fractal geometry provides tools for studying foggy (fractal) cloud-like images. And here we propose just one of these tools: the pointwise fractal dimension. By computing the fractal dimension of the large matrix at each point, we obtain another matrix of the same size. This derived matrix may be viewed as a topography of complexity, a parameter of considerable significance in the context of morphogenesis, even of foggy images. And furthermore, the derived image of the complexity of the original image may be expected to behave well under pixel averaging, or other resolution reducing transformations. For this invariance under scaling is a characteristic of fractals.
In summary, here is our proposal for viewing the morphogenetic process of a massive neural net:
given a large connection matrix, C
compute the pointwise dimension at each point, thus another large matrix, D
reduce the dimension as needed for viewing, to a smaller matrix, E
Given a time series of connection matrices, compute the derivatives D and E for each, and view the time series of matrices, E, as a time-lapse movie of the morphogenesis of the net.
An example using the nine universities of the University of California system would give this kind of a matrix according the frequency of use:
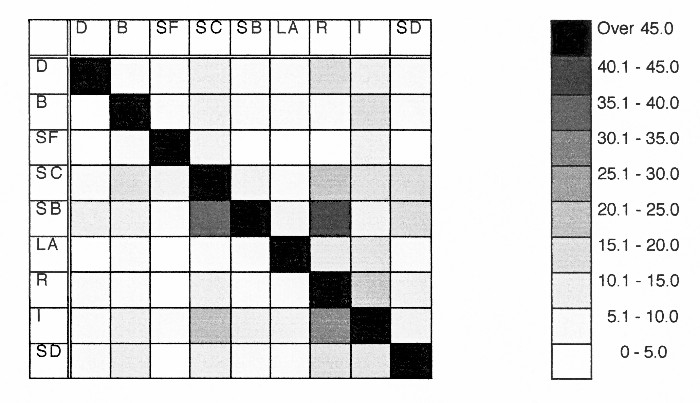
The grid with 10 variations in the number of connections would give a very simple pattern of pixels from black to white representing the exchange in a moment in time. Figuring in a change in connections over time would produce an animated matrix showing the change in the number of connection over a period of time.
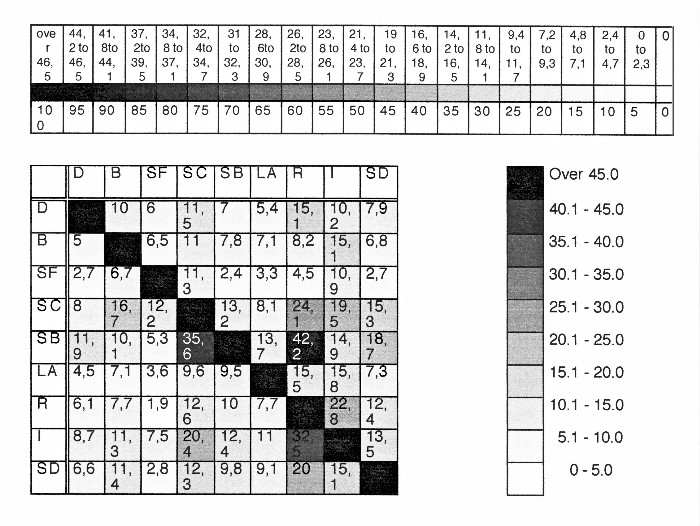
A more complex breakdown in the number of connections would produce a more complex grid.
The integration of the map into an interactive site has several possibilities. It could serve as a kind of back-drop to the whole thing encompassing the visualization of the network or at least the part of it we decide to illustrate. It could become a leitmotiv coming and going, somewhat like a cloud.
Taking the cloud idea we will obviously have to include enough connection pixels to give us a useful image. We can also think of using colors or at least one color rather then gray levels. To give the cloud more activity and emphasize its evolution and animation we could include in the program brief white spaces between gray levels as the pixels change. As a pixel changes from level 3 to level 4, for example, there could be a few frames of white which means the cloud would sparkle with small bursts of white as things change.
We are also studying a sound program built in so that the various pixels could change their musical value as they change as well.
MEASURING THE WWW:
Our strategy for viewing the morphogenetic process of a massive neural net may be applied to the WWW. But how to represent the Web as a Net? There are clearly two necessary steps: to define the nodes, and to measure the connection strengths. For each of these steps there are many possibilities. Here we describe only one approach to each.
Nodes: The WWW is a tree consisting of domains, servers, and pages. There are now tens of thousands of domains, several servers in each domain, and many pages in each server. Each domain has a unique name (for example, vismath.org), each server has a unique name (eg, www.vis-math.org) and IP address (eg, 162.227.70.1), and each page has a unique URL (eg, http://www.vismath.org/index.html). These are the main choices for nodes of the WWW. For reasons of size, mainly, let us regard domain names as the nodes of the Web. We may further reduce the size of the network to be visualized by considering only the suffices edu or org. Besides reducing to a smaller number of nodes, we might anticipate that the domains in the com class are relatively sparsely connected, and thus less interesting from the mathematical point of view.
Connections: The interconnections of the WWW, as a hypertext and hypermedia system, are links. Links connect pages, but pages are secondary to domains according to our choice above. Thus, given two domains, that is, nodes, we must determine all links from any page of the first domain, to any page of the second domain. Then this simple count should be normalized. That is, regarding the number of all pages of all servers of the first domain as a width, and all pages of all servers of the second domain as a height, we obtain a rectangle, the area of which (the product of the two page counts) may be regarded as contributing to the probability of a link. Thus, the connection strength we are proposing here is the ratio of the number of links to the product of the width and the height. A more precise measure might take into account the byte size of pages, or equivalently, the total storage served by each domain. However, this data is much more expensive to obtain. In any case, the data to construct the massive connection matrix for the entire WWW is to be collected by a Web crawler or robot, not just once, but repeatedly, according to our larger plan. And fortunately for this program, a number of Web crawlers are already at work collecting links for indices of the WWW. This is to be the basis for further work in this project.
CONCLUSION :
We have described a complete, step-by-step, procedure for the visualization of the complexity and morphogenesis of the World Wide Web. The implementation of this procedure, our next goal, aims at the installation of a website in which, like a weather report, the current web image, and movies of earlier web images, are available for browsing. The stages of this implementation, in review, are: obtain connection matrix data for domains *.org, *.edu from a web crawler, transform to a matrix of pointwise fractal dimension reduced by pixel averaging, post as GIF images on the web. We see this as a relatively simple program, the first step being the most difficult. For this first step we see two options: one is to write our own web crawler, the other is to enter into partnership with one of the existing WWW-index services, such as: Alta Vista, Yahoo, Excite, etc.
In order to complete this work within one year and develop a working mathematical model for a chosen domain, which would be applicable to any domain thereafter, we estimate the following budget:
Ralph Abraham, abraham@vismath.org Don Foresta, don@donforesta.net
Date: June, 1999
Santa Cruz, California Paris, France
 This work is licensed under a Creative Commons Attribution.